
Graph Pruning
Serendipity and the Art of Graph Maintenance

Cleaning your home often turns up things you’ve spent hours searching for, but tending your garden can lead to even bigger surprises.
This essay is part of the serendipity series.
When the pandemic happened, another virus hit the planet: the virus of Personal Knowledge Management tools. PKM-19 was not deadly and did not spread as widely as COVID-19. Yet that disease could be nasty in its own way: it could last years and become chronic. That's what happened to me.
Until 2019, there were just a handful of PKM tools. By the end of 2020, there were more than 50; as of today, there are over 80. Why this explosion? I have suggested three explanations. One comes from the evolutionary theory of punctuated equilibrium, another explanation can be derived using Ashby's law of requisite variety, and the third is that the explosion was also due to various lockdown effects. Check out the reasoning here.
I got infected at the beginning of 2020, and the particular virus was Roam Research. It had a few mutations like Athens Research, which did not last long; Hulunote, which spread only in China; and Logseq, which, like Hulunote, originated in China but spread all over the world.
While COVID-19 brings suffering and death, PKM-19 can increase productivity and support creativity. Most impressive of all, it can become a reliable serendipity generator. That's typical for PKMs that are structured, in one way or another, as knowledge graphs.
In a series of posts, I have described different aspects of Roam Research, and many of them are valid for other tools for networked thought. While the tool has some unique features, it offers no immunity to what we are all prone to: digital hoarding. Worse, it makes it easier. Apart from the content I created daily, the inflow of annotations from books and articles, liked tweets, and so on, via pipes connecting Roam to Readwise and other tools, made my graph expand quickly. What were the effects? Poor performance and noise in the search results.
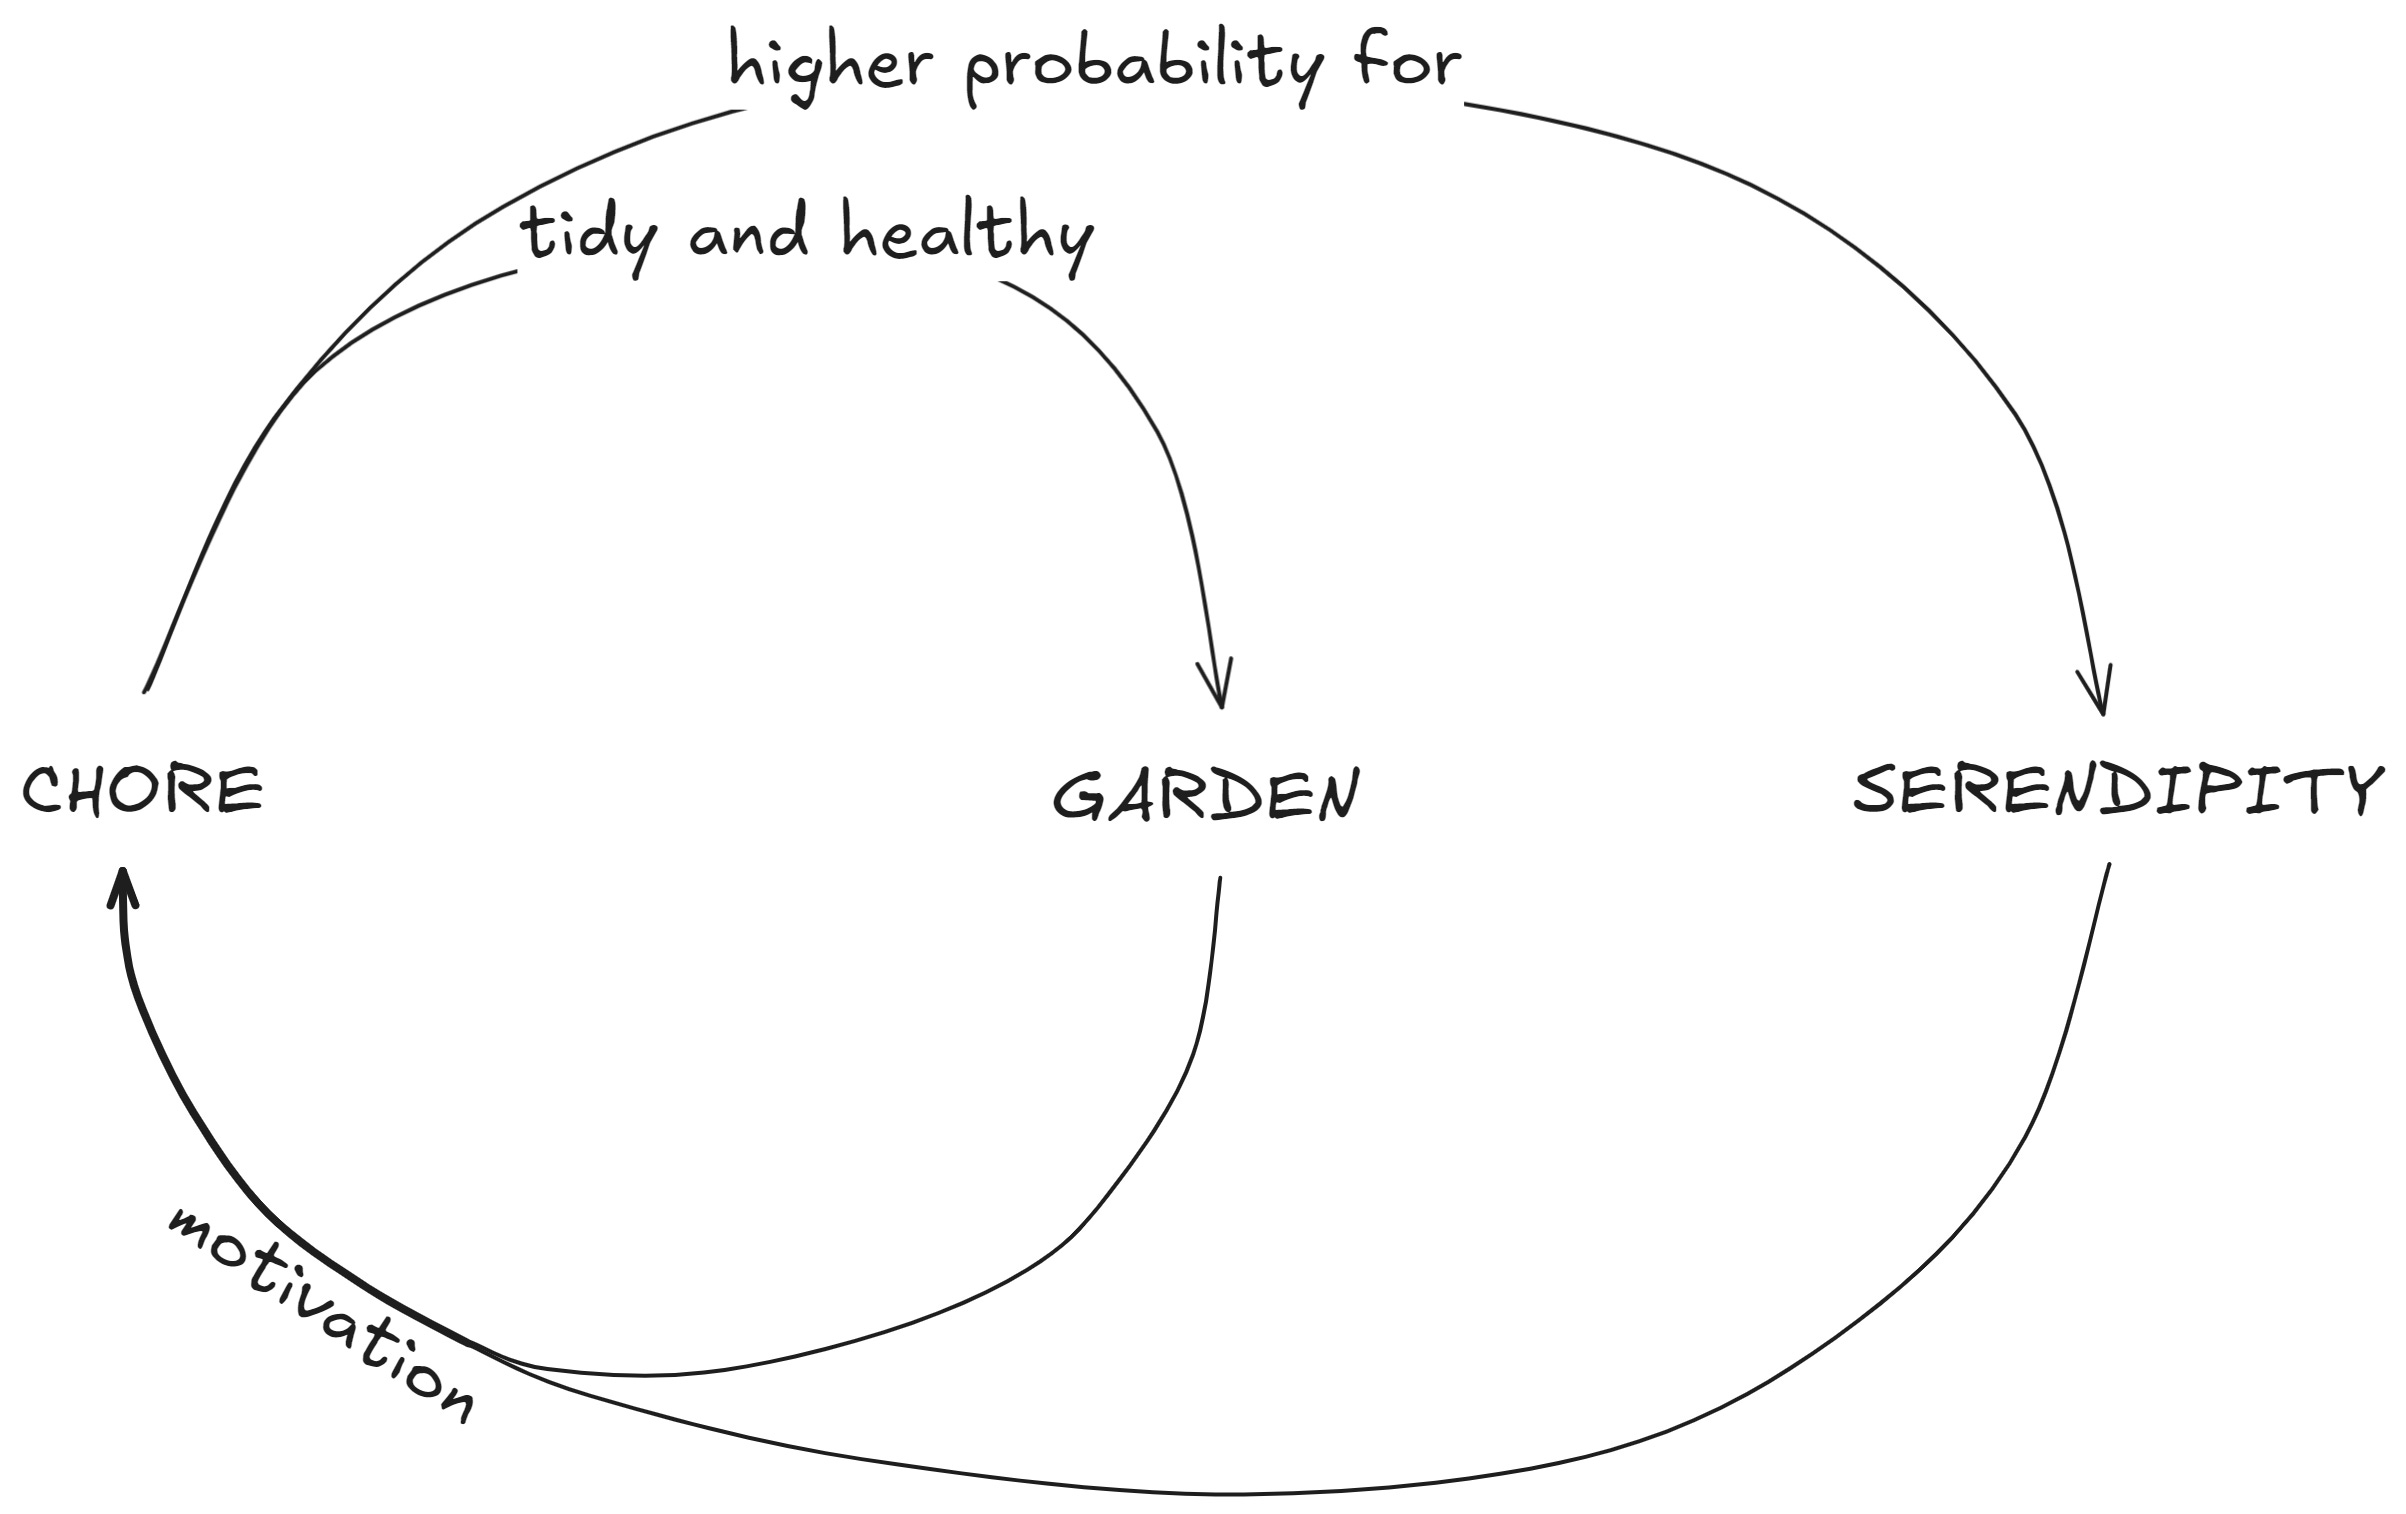
So, I decided to periodically allocate time and clear up my graph from content that was no longer useful or wasn't in the first place, like pages created from the hashtags of imported tweets that didn't coincide with my topics of interest. I tried different approaches, but none of them worked. They were housekeeping practices, after all, so no wonder they felt like chores. Plus, ages ago, when I was working on business process optimization, I developed an aversion to any kind of non-core activity, any kind of overhead, which lean practices rightfully labeled "waste." When it comes to software tools, they should serve us and not the other way around. However, my aversion to maintenance did not stop my graph from growing, and that wasn't just a problem of volume. In some parts, which were not for deleting, it was too unruly to be useful.
After some experimenting, the practice that stuck was something I called graph pruning. The name may have been influenced by the metaphor of digital gardening, but in any case, it described well what I was doing on a regular basis. After some tinkering, I reduced the time needed to do it and increased the effects. But that wasn't sufficient to keep me doing it regularly. That extra bit of motivation was unexpectedly brought by the increased supply of serendipity events.

How does graph pruning work? Every day, a script triggers several workflows, and my daily notes page gets populated with things for the day: meetings pulled from my calendar, tasks I’ve sent from previous days, resurfaced old thoughts and ideas, and anything else tagged with that date. For those unfamiliar with the concept of a daily notes page (DNP), that's the dynamic home page of some PKM tools, which brings a node of the graph every day that is reserved for the current date. Some tools allow that to trigger templates and workflows.
I'll not go into details now since what I find interesting is not the concrete implementation in the tool that I happened to use but the practice itself, especially the virtuous cycle pattern that characterizes why it works so well. Yet, for context, I'll share a few more general things. Then in the next part — of interest mostly to the Roam users — I’ll put the technical details and all the scripts and queries I use.
Roam is an outlier where each block is a node in the graph. During the week, my daily scripts bring, among other things, a log block with child blocks, which I named PACO and S4. Under the log come events and tasks that I clock. PACO and S4 group other tasks and events which I may or may not time-track. PACO stands for productivity, admin and coordination. S4, inspired by the Viable System Model, is for future-oriented activities. (Following this logic, PACO should be part of S2 and everything outside in the DNP, should be part of S1. If you are unfamiliar with the VSM, don't bother — it's irrelevant to what I'm about to explain. But if you are curious about that relation, this talk has some hints.)
On some days of the week, the graph pruning workflow is triggered, so under PACO, I get something like this.

The screenshot, in fact, shows the next step, where I have opened it on the sidebar and activated the time tracker. Number of pages is a counter which shows the current number of pages. In Roam Research, pages are nodes that are referred to with wikilinks. All other nodes are called blocks and referred to with block references. That's just a specific design decision. I believe there should be only nodes and only one way to refer to them, as in Tana. Anyway, the point is that my current graph pruning routine targets only the thick branches, the pages. In the future, I may start targeting blocks. There are now 170 thousand blocks in my graph. If I decide to target them, it would be a random selection from those that have a number of words and child blocks above a certain threshold.
My graph pruning algorithm initially brought simply a random selection of pages to review. Then, later, I also added the selection Pages to type or delete (the grey circle around the bullet indicates that the block is collapsed). Most of my pages have one or several types, which means that they are pages with is a relationship to a page that represents a class of the RIO ontology. Some blocks are typed as well by having a tag referring to a RIO class. Currently, I have 241 classes defined (need to update the GitLab repo) like Person (currently 1112 instances in my graph, pages), Event (1901, blocks) for things like meetings, tennis matches or barber appointments, Article (448, either), Tool (291, either), Issue (207, blocks) and so on. Typing (by which I mean declaring a type, in other words, classifying) is a useful practice, and this is not the place to enumerate the benefits. What's important for the current version of the graph pruning workflow is that, apart from the random subset of all pages, it also brings a random subset of the subset of all not-typed pages. And that's the reason for having the second counter.
I have varied the number of pages in both categories, and what stabilized is 16 random pages to review and 10 random not-typed pages to type, tidy up or delete if not needed.
This sounds like a lot of work, although when I started to track the time, it turned out not to be the case (I'll come back to this later). But initially, even the few minutes that it took felt like too much, so I often skipped it, and at some point, I was considering reducing it from three to one time a week.
Then, one day, when reviewing the randomly fetched pages, I found a page I had forgotten about, which had unexpected relevance to a problem I was working on that day and turned out to be the key to the solution to that problem. On another day, a few weeks later, it was a page of a person I hadn't heard about for years, so reaching out to catch up brought another serendipitous episode. A few incidents like these changed my motivation for the graph pruning practice, and instead of reducing it, I increased the trigger to run five days a week.
Once I finish pruning, I can see the effect on the overall number of pages and the number of untyped pages.

Of course, that doesn't measure the full effect. Apart from deleting unnecessary pages and typing those that need to be typed, the routine includes making new connections and tidying up messy pages.
The screenshot is taken with a mouse hover on the block of Pages to type or delete. That is why you see the hidden tag .#self-distruct. Since I don't want my routine to increase the clutter, the two lists are automatically deleted from the graph after two days.
Recently, I started noting all serendipity incidents. When such happens during graph pruning, I make a note under the main block, bringing up the relevant page; that is why it's the only block to be kept. Doing so helps me track how many occurred during graph pruning, thanks to the [[pruning]] reference. Here's the heatmap of serendipity events in the last four months:

Of 27 serendipity events in the last four months, 13 were due to graph pruning.
This astonishing result is due to bringing controlled randomness to something living.
The routine is simple and easy to describe and reproduce. Yet, it might not work for everyone since not every graph is "alive."
The average time it took to carry out a graph pruning daily task was a little above 8 minutes, but that's due to an outlier of 55 minutes on the 5th of August, where I had four serendipity events. Otherwise, the median in this series is 6 minutes. Overall, just a dozen times, and it took a bit more than 10 minutes.
And yet, that little daily effort would have been too much to maintain if it had not created a virtuous cycle. The anticipation of serendipitous events provided the extra motivation to keep pruning. On most days, no serendipity event occurred, but the effort was worth it since it improved the graph by removing unnecessary elements, organizing the messy parts, and enhancing querying and filtering with more pages featuring declared types.
Stay tuned for the second part, where I’ll share some technical details, including scripts and queries used in graph pruning.